My Journeys
Designing a unified operational surface for tracking, decision-making, and closure
TL;DR
I redesigned My Journeys from a broken table and unreliable lifecycle system into a unified operational surface that models journeys correctly, supports real-world ambiguity, and helps operations teams decide and act faster.
Overview
My Journeys was one of the most heavily used parts of the product. It was where operations teams tracked active movements, identified issues, and managed execution. Over time, it had degraded into a mix of a table, a dashboard, and a partially broken lifecycle system.
The problem was not just UI clutter. The underlying model of journeys was flawed, and the interface reflected that confusion. I treated this as a system redesign, not a table redesign, and rebuilt both the lifecycle logic and the decision surface together.
Product Gallery
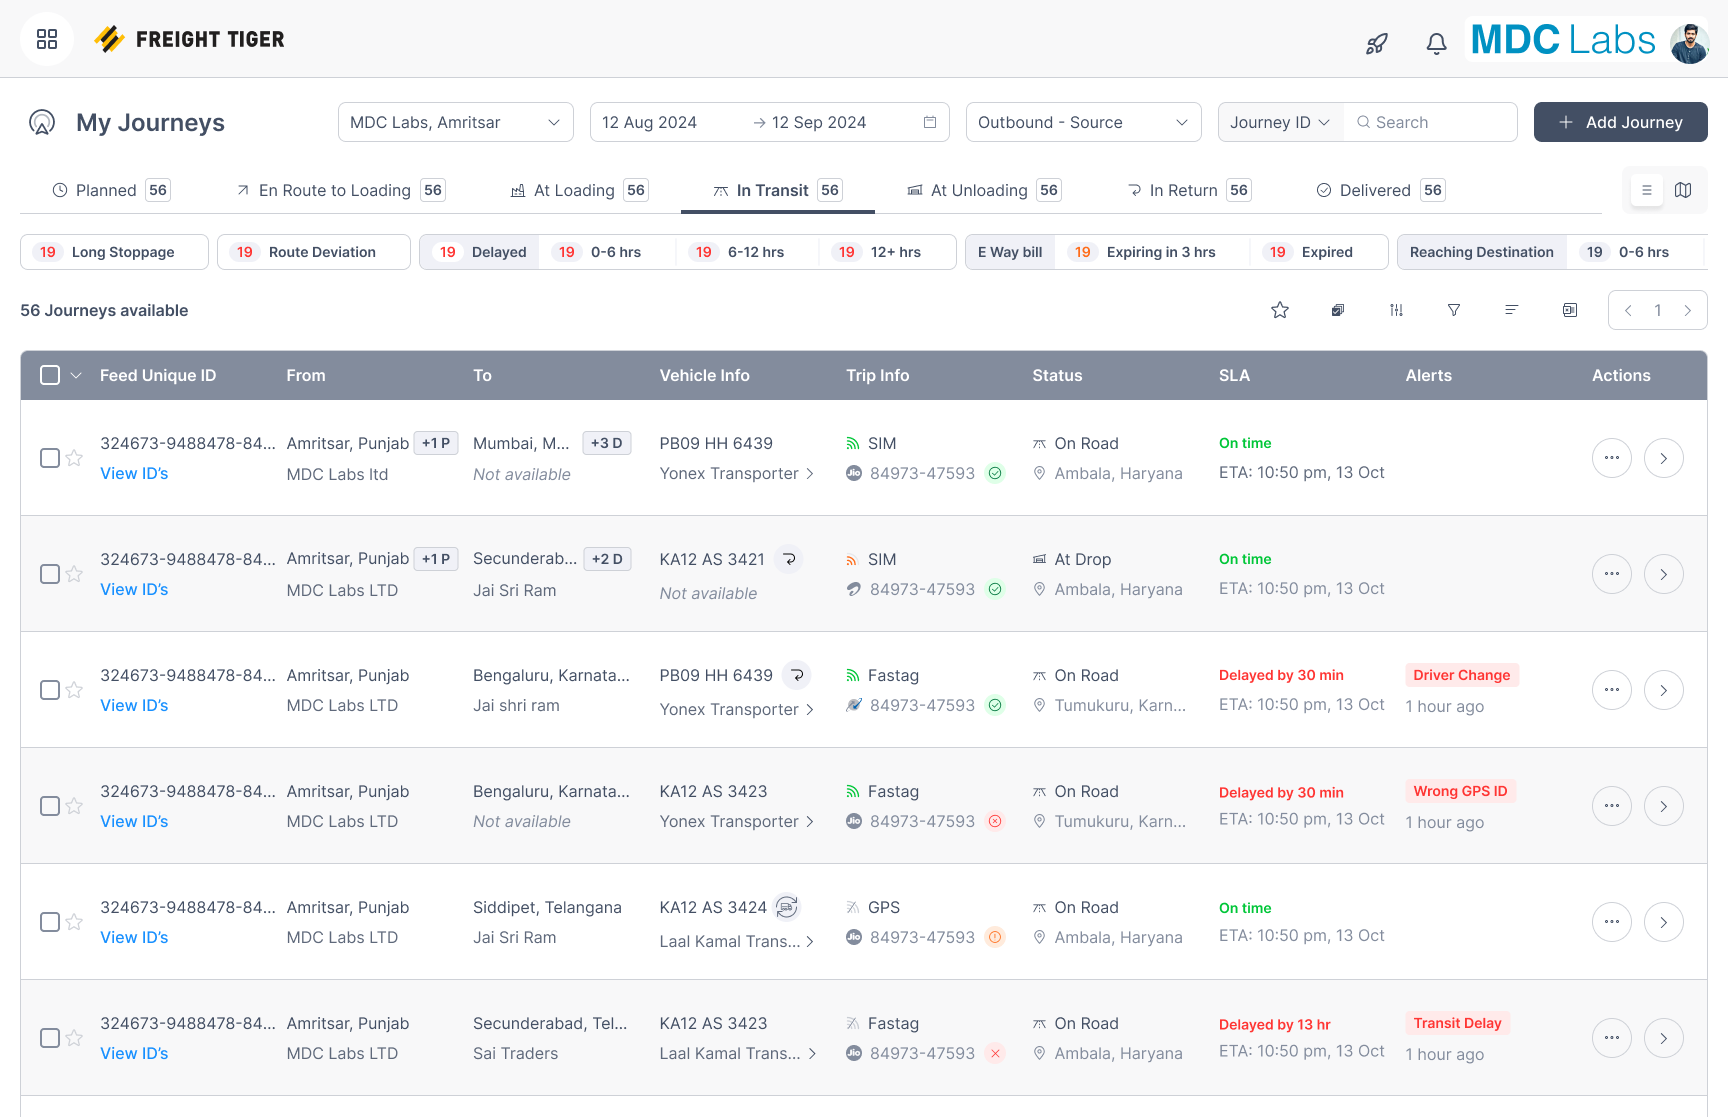
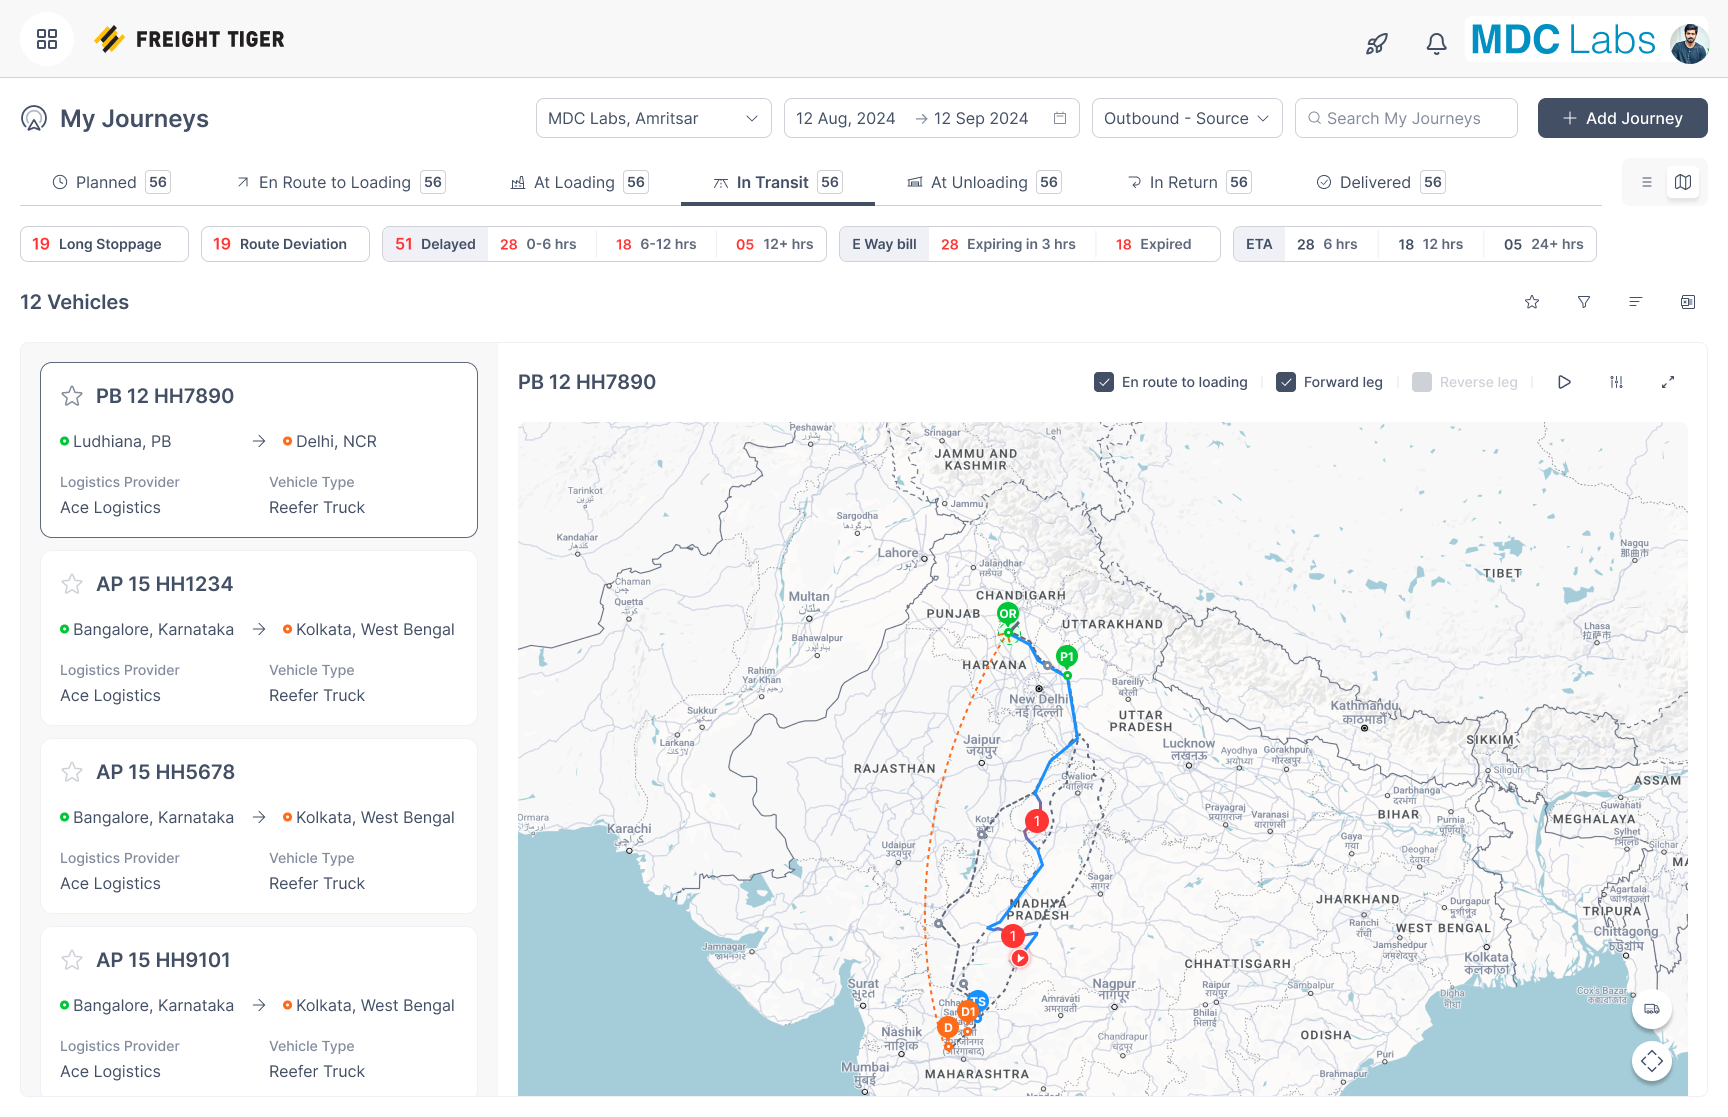
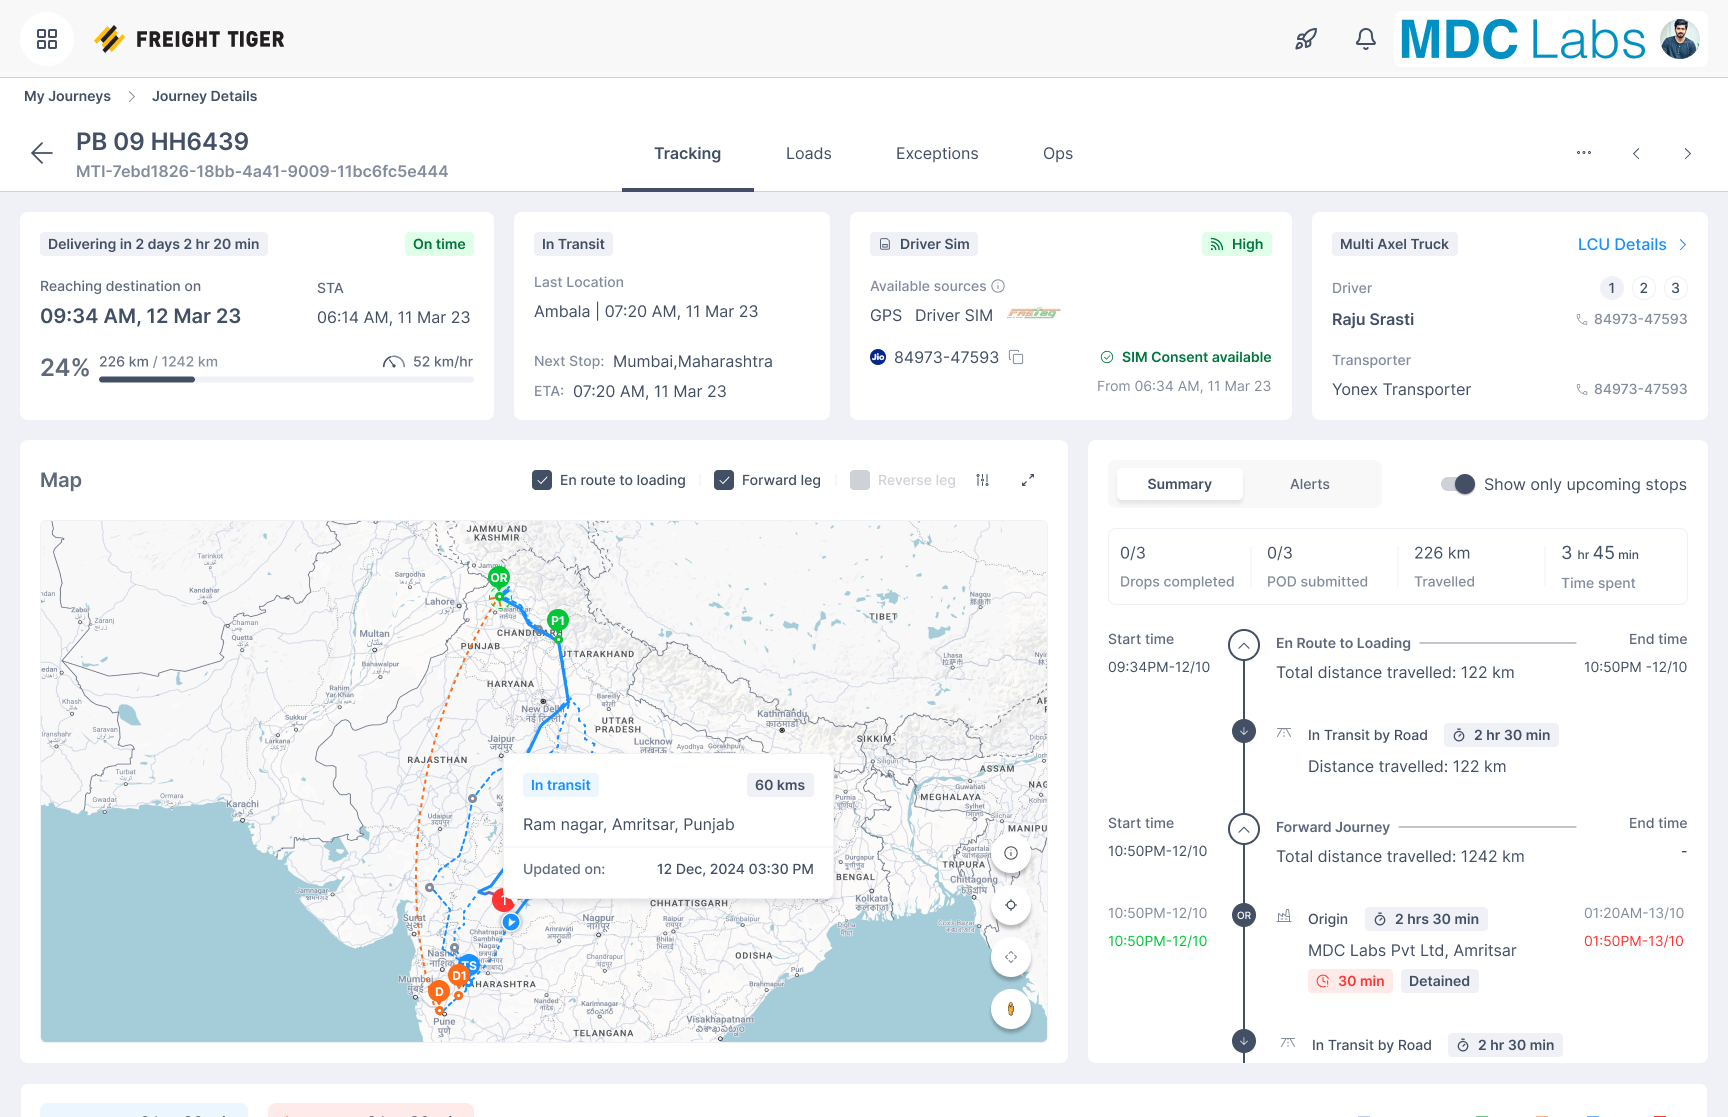
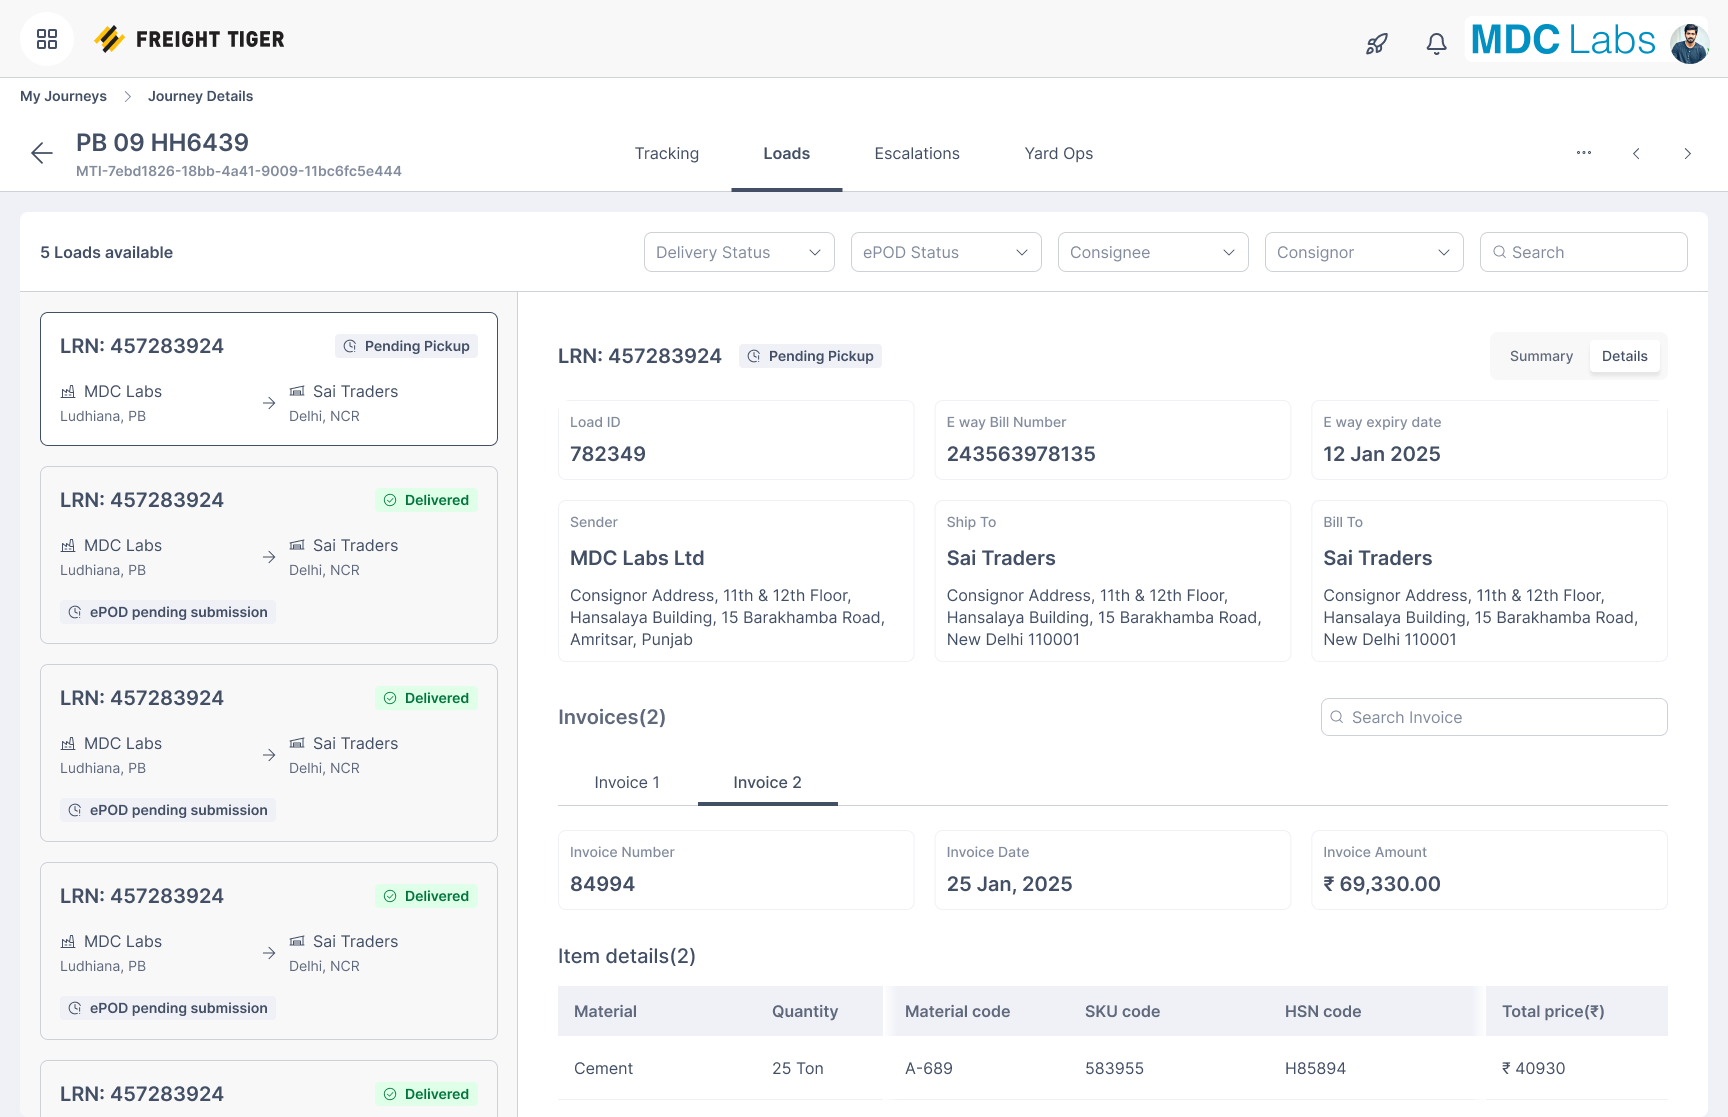
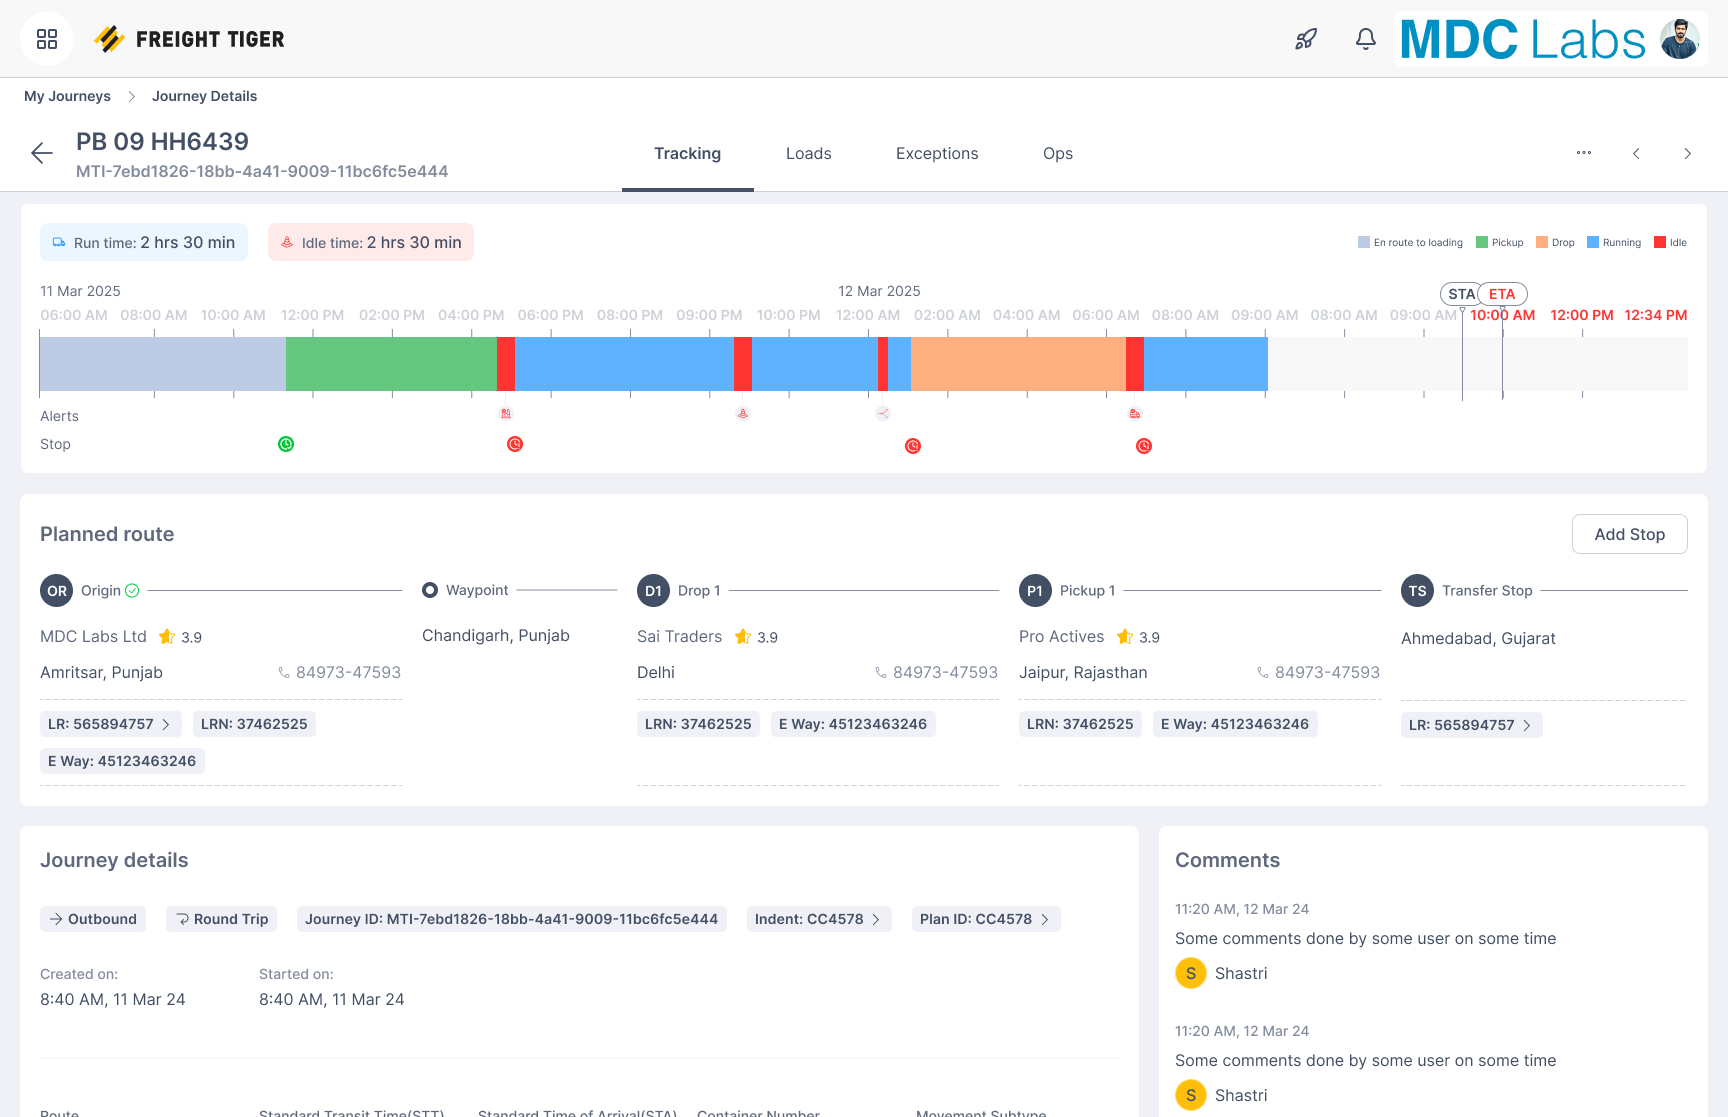
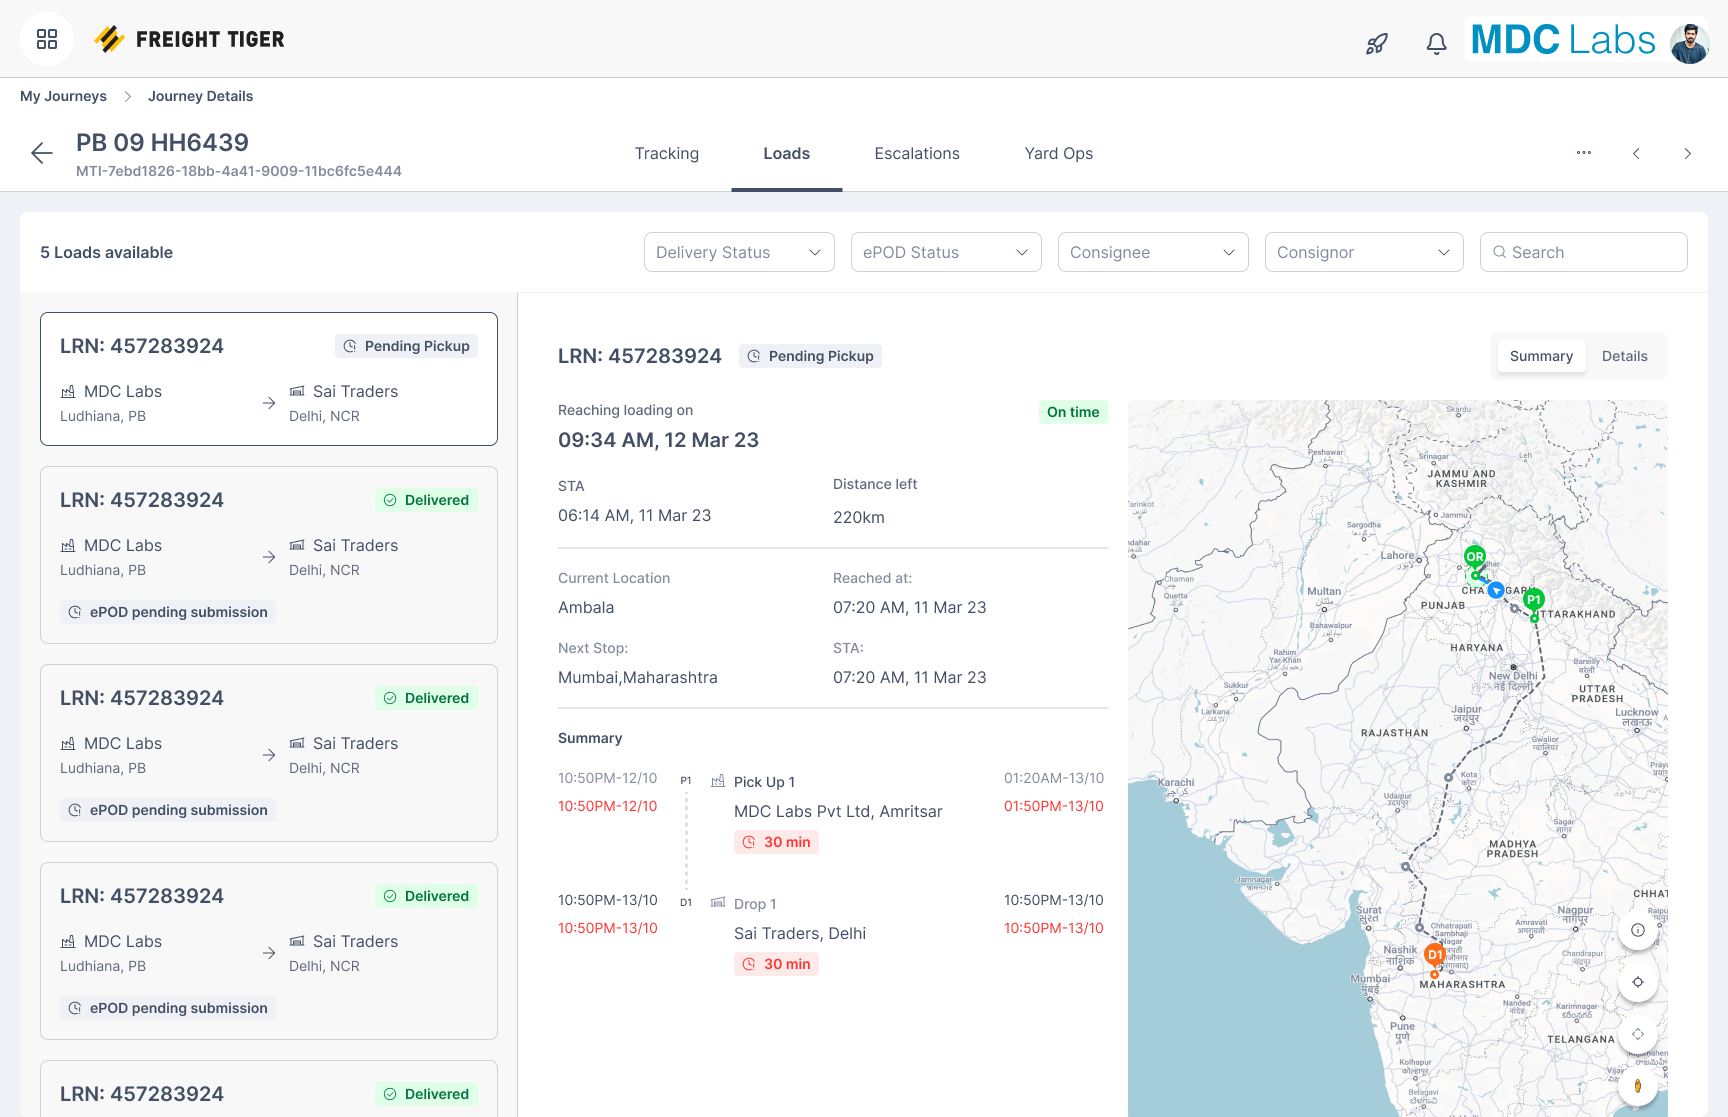
Developed screens from My Journeys showing the final operational flow from the main in-transit surface into map context, journey details, and loads management.
What Made This Hard
Two layers were broken at the same time.
At the system level, the journey lifecycle was incorrectly modeled. It assumed linear movement and clean closure, while real operations involved reuse, repeated stops, missing data, and ambiguity.
At the interface level, the table had become overloaded with information. It exposed everything but helped with nothing. Fixing only the UI would not solve the problem. Fixing only the lifecycle would not make the product usable. Both had to be redesigned together.
Problem
The lifecycle system treated journeys as linear flows that started and ended cleanly. In reality, routes were reused, stops repeated, and signals arrived inconsistently. This led to overwritten data, incorrect closure states, and unreliable journey tracking.
The table interface had accumulated too many columns, statuses, and visual elements. Everything competed for attention. It was slow to scan, hard to prioritize, and not usable under operational pressure. Together, these issues created a system where users had to manually reconstruct reality from unreliable data and noisy interfaces.
Context
Operations teams used this screen to manage large numbers of active journeys in real time. Their goal was not to read detailed rows. Their goal was to quickly identify what was going wrong and decide what to do next.
Data came from multiple sources including GPS pings, geofence events, and manual updates. Real-world patterns such as route reuse and repeated locations exposed the limitations of a system that assumed each stop occurred only once.
Reframing the Problem
I reframed My Journeys from a data table into an operational decision system. The key shift was moving from showing journey data to:
- — Helping users understand journey state
- — Helping users identify risk
- — Helping users decide what action to take
This required fixing both the underlying model and the way it was presented.
System Redesign: Lifecycle Model
The first step was correcting how journeys were modeled. I moved away from treating journeys as simple sequences of stops and instead introduced a state-driven model.
A critical concept was separating a stop from a visit. The same physical location could appear multiple times in a journey, but each occurrence needed to be tracked as a separate visit. This allowed patterns like A → B → A to be handled without corrupting data.
Instead of overwriting journey state, I leaned toward preserving event history. Each signal contributed to an evolving state rather than replacing previous information.
Closure was redesigned to be event-driven. A journey did not close because a user followed a fixed flow. It closed when the correct combination of events occurred.
Interface Redesign: Table as Decision Surface
Once the model was corrected, I redesigned the table to reflect how users actually think. The table was no longer treated as a container of columns. It was treated as a surface for decision-making.
I reorganized information around intent. Status, exceptions, and action-relevant signals were prioritized. Secondary information was reduced or removed. Hierarchy became the main tool — important states stood out clearly while non-critical information moved into the background.
Edge Cases Handled
The redesign accounted for route reuse such as A → B → A, missing or delayed tracking signals, manual overrides, ambiguous states, and large datasets with multiple filters applied simultaneously.
Key Design Decisions
- — Treated the table as a decision surface rather than a data grid
- — Grouped information by operational intent instead of letting columns compete equally
- — Removed visual noise aggressively — many accumulated elements were not helping decision-making
- — Aligned the interface with the lifecycle model so the UI reflected corrected system state
Outcome
The result was a system where users could trust what they saw and act on it quickly.
Journey tracking became more accurate because the lifecycle model reflected real-world behavior. Closure became more reliable because it was tied to events rather than assumptions. The interface became easier to scan because it emphasized what mattered.
Why This Project Matters
This project represents how I approach complex product problems. I do not treat UI issues in isolation. I look at the underlying system, fix the model, and then design the interface to reflect that model. My Journeys is not just a table redesign. It is a case study in turning a broken operational surface into a reliable decision system.
Learnings
- — Operational products break when their internal models do not match reality. Fixing the model often has more impact than adding features.
- — Interfaces should reflect how decisions are made, not how data is stored.
- — Simplicity in UI often comes from deeper complexity in system design, not from removing features blindly.
# My Journeys
> Designing a unified operational surface for tracking, decision-making, and closure

- Role: Senior Product Designer
- Company: Freight Tiger
- Timeline: 2024

## TL;DR

I redesigned My Journeys from a broken table and unreliable lifecycle system into a unified operational surface that models journeys correctly, supports real-world ambiguity, and helps operations teams decide and act faster.

## Overview

My Journeys was one of the most heavily used parts of the product. It was where operations teams tracked active movements, identified issues, and managed execution. Over time, it had degraded into a mix of a table, a dashboard, and a partially broken lifecycle system.

The problem was not just UI clutter. The underlying model of journeys was flawed, and the interface reflected that confusion. I treated this as a system redesign, not a table redesign, and rebuilt both the lifecycle logic and the decision surface together.

## Product Gallery

Developed screens from My Journeys showing the final operational flow from the main in-transit surface into map context, journey details, and loads management.

- In Transit: The primary operational surface for understanding live journey state, blockers, and next actions.
- Map View: A spatial layer from the in-transit experience for understanding route context and operational status visually.
- Journey Details: The actual journey details page, combining map context, timeline signals, and operational status in one view.
- Loads: The loads surface for scanning active movements, spotting exceptions, and switching into the right operational context.
- Journey Summary: A condensed status layer for reading progress, key state changes, and closure-related signals at a glance.
- Loads Alternate State: Another loads state demonstrating the same hierarchy and actionability at operational scale.

## What Made This Hard

Two layers were broken at the same time.

At the system level, the journey lifecycle was incorrectly modeled. It assumed linear movement and clean closure, while real operations involved reuse, repeated stops, missing data, and ambiguity.

At the interface level, the table had become overloaded with information. It exposed everything but helped with nothing. Fixing only the UI would not solve the problem. Fixing only the lifecycle would not make the product usable. Both had to be redesigned together.

## Problem

The lifecycle system treated journeys as linear flows that started and ended cleanly. In reality, routes were reused, stops repeated, and signals arrived inconsistently. This led to overwritten data, incorrect closure states, and unreliable journey tracking.

The table interface had accumulated too many columns, statuses, and visual elements. Everything competed for attention. It was slow to scan, hard to prioritize, and not usable under operational pressure. Together, these issues created a system where users had to manually reconstruct reality from unreliable data and noisy interfaces.

## Context

Operations teams used this screen to manage large numbers of active journeys in real time. Their goal was not to read detailed rows. Their goal was to quickly identify what was going wrong and decide what to do next.

Data came from multiple sources including GPS pings, geofence events, and manual updates. Real-world patterns such as route reuse and repeated locations exposed the limitations of a system that assumed each stop occurred only once.

## Reframing the Problem

I reframed My Journeys from a data table into an operational decision system. The key shift was moving from showing journey data to:

- Helping users understand journey state
- Helping users identify risk
- Helping users decide what action to take

This required fixing both the underlying model and the way it was presented.

## System Redesign: Lifecycle Model

The first step was correcting how journeys were modeled. I moved away from treating journeys as simple sequences of stops and instead introduced a state-driven model.

A critical concept was separating a stop from a visit. The same physical location could appear multiple times in a journey, but each occurrence needed to be tracked as a separate visit. This allowed patterns like A → B → A to be handled without corrupting data.

Instead of overwriting journey state, I leaned toward preserving event history. Each signal contributed to an evolving state rather than replacing previous information.

Closure was redesigned to be event-driven. A journey did not close because a user followed a fixed flow. It closed when the correct combination of events occurred.

## Interface Redesign: Table as Decision Surface

Once the model was corrected, I redesigned the table to reflect how users actually think. The table was no longer treated as a container of columns. It was treated as a surface for decision-making.

I reorganized information around intent. Status, exceptions, and action-relevant signals were prioritized. Secondary information was reduced or removed. Hierarchy became the main tool — important states stood out clearly while non-critical information moved into the background.

## Edge Cases Handled

The redesign accounted for route reuse such as A → B → A, missing or delayed tracking signals, manual overrides, ambiguous states, and large datasets with multiple filters applied simultaneously.

## Key Design Decisions

- Treated the table as a decision surface rather than a data grid
- Grouped information by operational intent instead of letting columns compete equally
- Removed visual noise aggressively — many accumulated elements were not helping decision-making
- Aligned the interface with the lifecycle model so the UI reflected corrected system state

## Outcome

The result was a system where users could trust what they saw and act on it quickly.

Journey tracking became more accurate because the lifecycle model reflected real-world behavior. Closure became more reliable because it was tied to events rather than assumptions. The interface became easier to scan because it emphasized what mattered.

## Why This Project Matters

This project represents how I approach complex product problems. I do not treat UI issues in isolation. I look at the underlying system, fix the model, and then design the interface to reflect that model. My Journeys is not just a table redesign. It is a case study in turning a broken operational surface into a reliable decision system.

## Learnings

- Operational products break when their internal models do not match reality. Fixing the model often has more impact than adding features.
- Interfaces should reflect how decisions are made, not how data is stored.
- Simplicity in UI often comes from deeper complexity in system design, not from removing features blindly.